 Iocaine
iocaine can be configured to expose Prometheus-compatible metrics, on an endpoint separate from the garbage generator. When enabled, two groups of metrics are exposed: iocaine’s own metrics, and process metrics such as the process start time, CPU seconds used, resident memory used, and so on. Where relevant, the iocaine version that introduced the metric will be highlighted.
Metrics are not enabled by default, one has to manually configure iocaine to make them available:
[metrics]
enable = true
By default, metrics are lost when iocaine shuts down, but - since iocaine 2.4.0 - if the [metrics].persist-path option is set, then iocaine will save its metrics on shutdown, and will load compatible ones when starting back up.
iocaine metrics
There are three iocaine-specific metrics exposed:
iocaine_requests_totalThe number of requests served by iocaine.
iocaine_garbage_servedThe amount of garbage generated, in bytes. This does not include HTTP headers, and is calculated before any compression by the fronting reverse proxy.
Note: Prior to iocaine 1.1.0, this metric was always unlabeled.
iocaine_maze_depthThe depth of the explored maze, in number of path elements. This is the deepest a visitor has gone in the maze.
Introduced in: iocaine 1.1.0
iocaine_challengesThe number of challenges served by iocaine. To serve a challenge, a custom request handler is required.
Introduced in: iocaine 2.2.0
iocaine_request_handler_hits{id="..."}The number of times a particular “id” in the request handler was hit. This metric is fully controlled by the request handler, if any, and as such, the
idlabel’s meaning and purpose is also controlled by the request handler.Unlike most other metrics,
idis the only label attached to this one.Introduced in: iocaine 2.3.0
iocaine_version{version="2.0.0-snapshot"}The version of the iocaine instance, provided within the
versionlabel. The value is always one, and no other labels are provided.Introduced in: iocaine 2.0.0
All of these metrics (except iocaine_version and iocaine_request_handler_hits) are augmented with the same set of - optional - labels, and are emitted without labels by default:
# HELP iocaine_garbage_served Total amount of garbage served (in bytes)
# TYPE iocaine_garbage_served counter
iocaine_garbage_served 56924

# HELP iocaine_requests_total Total number of requests served
# TYPE iocaine_requests_total counter
iocaine_requests_total 69

# HELP iocaine_maze_depth Maximum explored depth of the maze (in path parts)
# TYPE iocaine_maze_depth counter
iocaine_maze_depth 10

# HELP iocaine_challenges Number of challenges presented
# TYPE iocaine_challenges counter
iocaine_challenges 0

# HELP iocaine_request_handler_hits Total number of times the request handler was invoked
# TYPE iocaine_request_handler_hits counter
iocaine_request_handler_hits{id="some-random-id"} 1

# HELP iocaine_version Version of the running iocaine (in the 'version' label)
# TYPE iocaine_version gauge
iocaine_version{version="2.0.0"} 1
Labels
Important
Labels are only applied to the iocaine metrics. The process metrics are always unlabeled.
There are four labels that can be enabled via [metrics].labels: host, user_agent, user_agent_group, and verdict. These can be used to group the iocaine metrics by host, user agent, user agent group, verdict, or any combination of those. As the user agent is entirely externally controlled, it is recommended to keep that label turned off, because it makes it very easy to fake a million different user agents, which will make metrics very expensive to keep track of, to ingest, and to work with.
When using the user_agent_group label, it is strongly recommended to have a catch-all rule as the last one, to limit how many groups there may be.
Lets see a few examples!
Host labels
[metrics]
enable = true
labels = [ "Host" ]
This will expose the following metrics on http://127.0.0.1:42042/metrics:
# HELP iocaine_garbage_served Total amount of garbage served (in bytes)
# TYPE iocaine_garbage_served counter
iocaine_garbage_served{host="example.com"} 1508
iocaine_garbage_served{host="another.example.com"} 4074

# HELP iocaine_requests_total Total number of requests served
# TYPE iocaine_requests_total counter
iocaine_requests_total{host="example.com"} 1
iocaine_requests_total{host="another.example.com"} 2

# HELP iocaine_maze_depth Maximum explored depth of the maze (in path parts)
# TYPE iocaine_maze_depth counter
iocaine_maze_depth{host="example.com"} 10
iocaine_maze_depth{host="another.example.com"} 1
User agent labels
Important
It is usually not a good idea to use the
UserAgentlabel, because that can lead to metrics balooning out of control. Only use that label if you keep a close eye on Prometheus.
[metrics]
enable = true
labels = [ "UserAgent" ]
This will expose the following metrics on http://127.0.0.1:42042/metrics:
# HELP iocaine_garbage_served Total amount of garbage served (in bytes)
# TYPE iocaine_garbage_served counter
iocaine_garbage_served{user_agent="curl/8.11"} 7916
iocaine_garbage_served{user_agent="bad bot/666"} 262144

# HELP iocaine_requests_total Total number of requests served
# TYPE iocaine_requests_total counter
iocaine_requests_total{user_agent="curl/8.11"} 6
iocaine_requests_total{user_agent="bad bot/666"} 202

# HELP iocaine_maze_depth Maximum explored depth of the maze (in path parts)
# TYPE iocaine_maze_depth counter
iocaine_maze_depth{user_agent="curl/8.11"} 1
iocaine_maze_depth{user_agent="bad bot/666"} 71
User agent grouping
The downside of the user_agent label is that it is unbounded, and the user agent strings tend to be long. To make it easier to group by agents, another label is available: user_agent_group. This label is applied by matching a list of regexps against the user agent, and if any matches, the corresponding group will be set for the value of the user_agent_group label. This is best demonstrated by an example:
[metrics]
enable = true
labels = [ "UserAgent", "UserAgentGroup" ]

[[metrics.agent_group]]
agent = "(?i:bad bot)"
group = "BadBot"

[[metrics.agent_group]]
agent = "."
group = "Other"
Do note that the UserAgentGroup label can be used without UserAgent! They’re used here together for demonstration purposes. With the above setup, we’ll get metrics like the following exposed on http://127.0.0.1:42042/metrics:
# HELP iocaine_garbage_served Total amount of garbage served (in bytes)
# TYPE iocaine_garbage_served counter
iocaine_garbage_served{user_agent="curl/8.11", user_agent_group="Other"} 7916
iocaine_garbage_served{user_agent="bad bot/666", user_agent_group="BadBot"} 262144
iocaine_garbage_served{user_agent="bad bot/666.1", user_agent_group="BadBot"} 1279

# HELP iocaine_requests_total Total number of requests served
# TYPE iocaine_requests_total counter
iocaine_requests_total{user_agent="curl/8.11", user_agent_group="Other"} 6
iocaine_requests_total{user_agent="bad bot/666", user_agent_group="BadBot"} 202
iocaine_requests_total{user_agent="bad bot/666.1", user_agent_group="BadBot"} 1

# HELP iocaine_maze_depth Maximum explored depth of the maze (in path parts)
# TYPE iocaine_maze_depth counter
iocaine_maze_depth{user_agent="curl/8.11", user_agent_group="Other"} 1
iocaine_maze_depth{user_agent="bad bot/666", user_agent_group="BadBot"} 71
iocaine_maze_depth{user_agent="bad bot/666.1", user_agent_group="BadBot"} 18
Request handler verdict
Important
The verdict label is new in iocaine 2.2.0, and is mostly useful when using the customisable request handler. If not using it, the verdict will always be “accept::garbage”.
The iocaine 2.2.0 release introduced a scriptable request handler, which lets the custom script decide what to do with an incoming request: accept it and serve it garbage, accept it, and serve it a challenge, or reject to handle it. The verdict label contains the outcome of this decision.
[metrics]
enable = true
labels = [ "Verdict" ]
This will expose the following metrics on http://127.0.0.1:42042/metrics:
# HELP iocaine_garbage_served Total amount of garbage served (in bytes)
# TYPE iocaine_garbage_served counter
iocaine_garbage_served{verdict="accept::garbage"} 56924

# HELP iocaine_requests_total Total number of requests served
# TYPE iocaine_requests_total counter
iocaine_requests_total{verdict="accept::garbage"} 69
iocaine_requests_total{verdict="accept::challenge"} 1
iocaine_requests_total{verdict="reject::not_for_us"} 42

# HELP iocaine_maze_depth Maximum explored depth of the maze (in path parts)
# TYPE iocaine_maze_depth counter
iocaine_maze_depth{verdict="accept::garbage"} 10

# HELP iocaine_challenges Number of challenges presented
# TYPE iocaine_challenges counter
iocaine_challenges{verdict="accept::challenge"} 1
Process metrics
Important
Process-specific metrics are new to iocaine 1.1.0, except for
process_start_time_seconds.
When metrics are enabled, the following process metrics are exposed:
process_start_time_secondsStart time of the process since unix epoch in seconds.
Note: Prior to iocaine 1.1.0, this metric always had a
servicelabel withiocaineas its value. That is no longer the case, it is unlabeled in more recent versions.process_cpu_seconds_totalTotal user and system CPU time spent in seconds.
Introduced in: iocaine 1.1.0
process_resident_memory_bytesResident memory size in bytes.
Introduced in: iocaine 1.1.0
process_virtual_memory_bytesVirtual memory size in bytes.
Introduced in: iocaine 1.1.0
process_threadsNumber of OS threads in the process.
Introduced in: iocaine 1.1.0
process_open_fdsNumber of open file descriptors.
Introduced in: iocaine 1.1.0
process_max_fdsMaximum umber of open file descriptors.
Introduced in: iocaine 1.1.0
Prometheus configuration
The iocaine metrics are exposed on an unauthenticated address, and Prometheus can be told to scrape it with a configuration akin to the following example:
scrape_configs:
- job_name: iocaine-job
  static_configs:
  - targets: ['localhost:42042']
Dashboard
A Grafana dashboard is available to get you started with monitoring iocaine with Grafana.
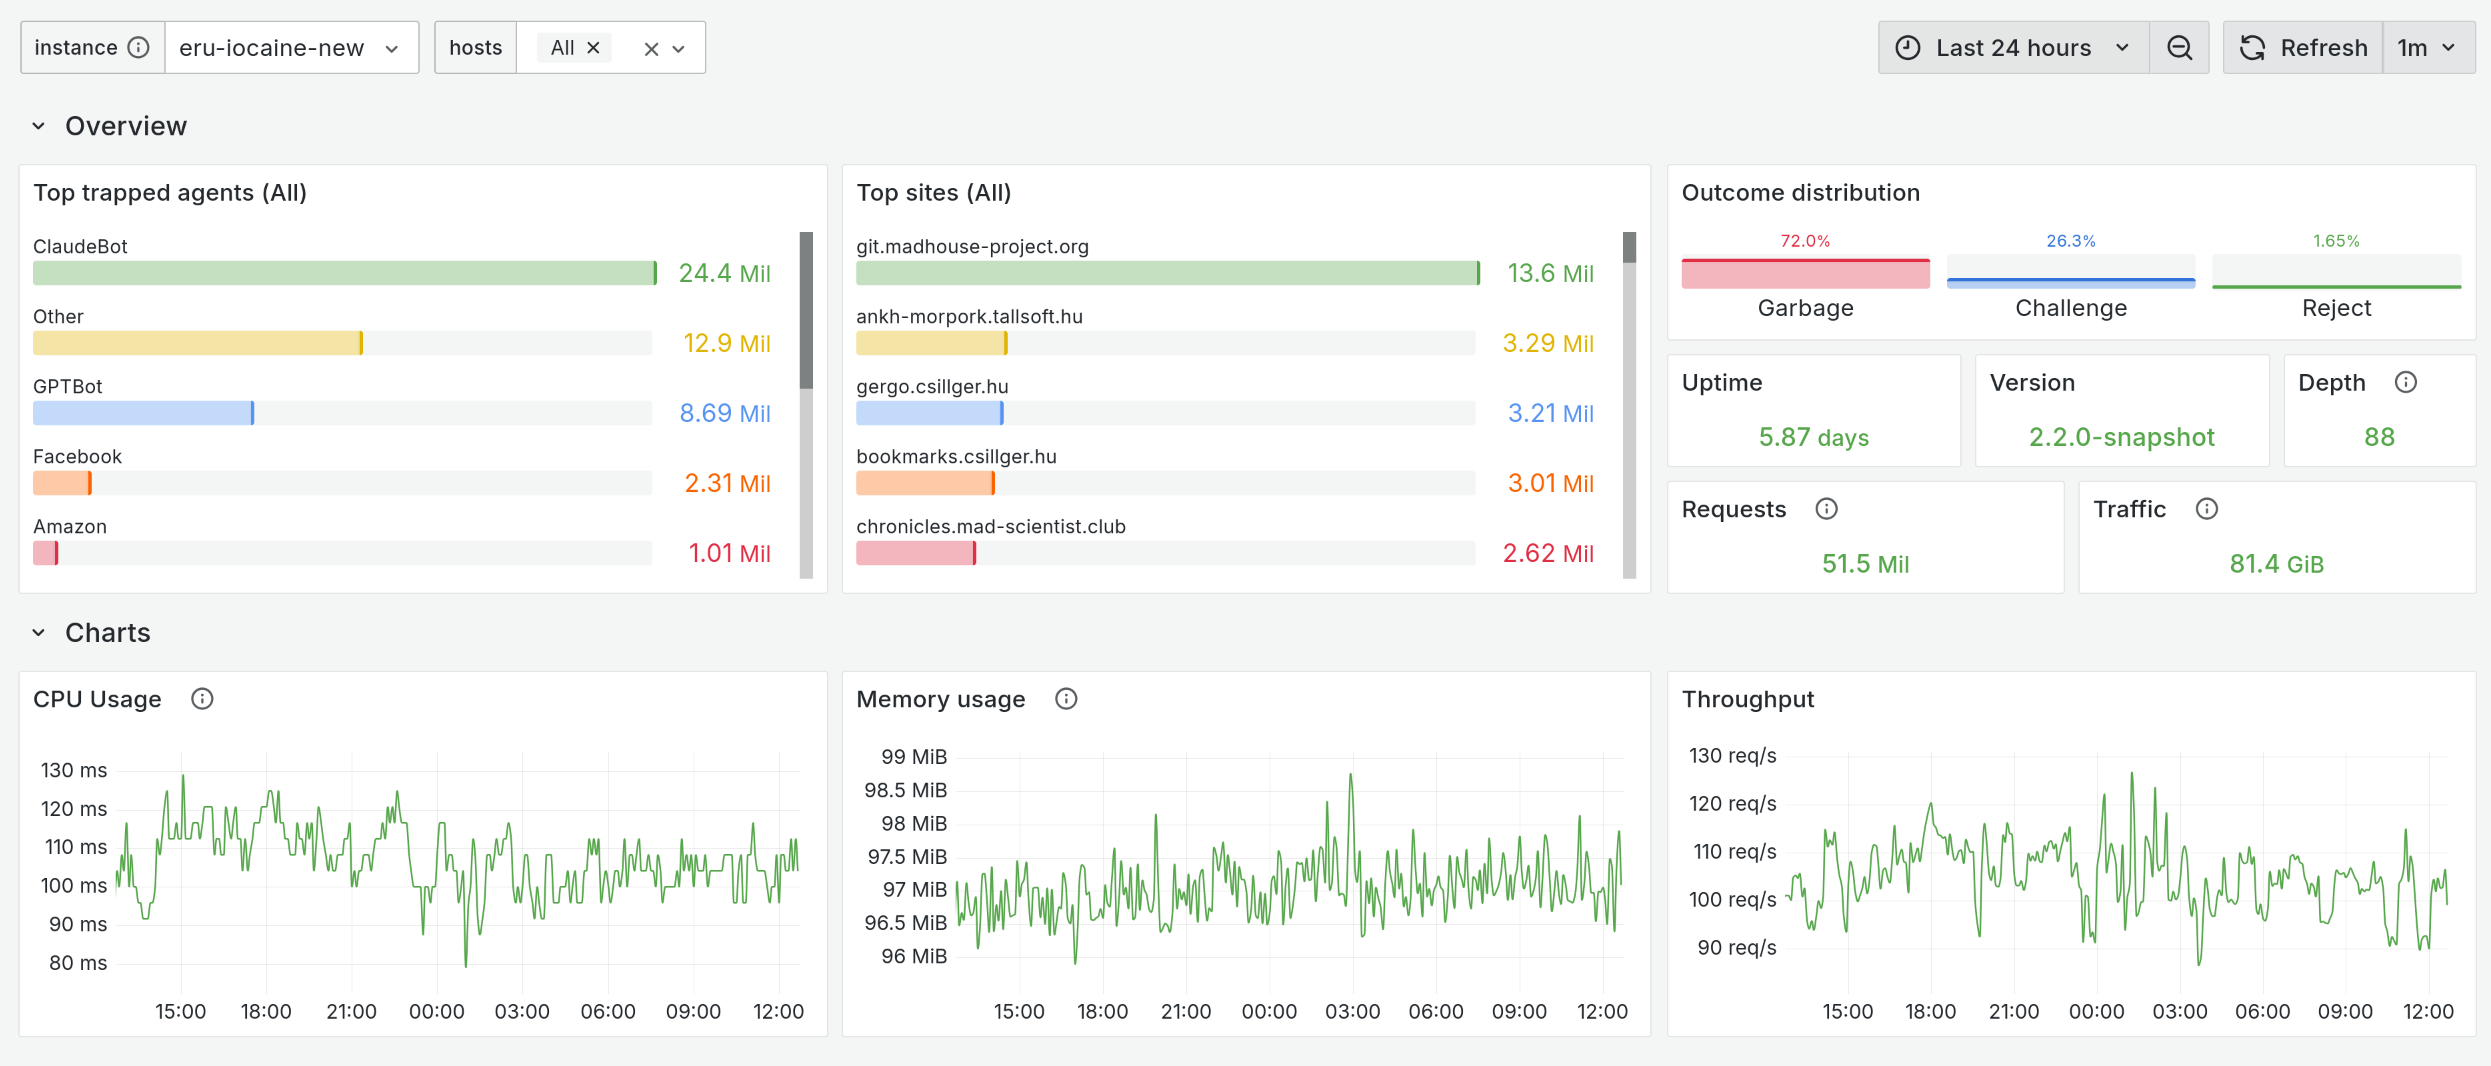
It assumes a configuration where the following labels are enabled:
[metrics]
enable = true
labels = [ "Host", "UserAgentGroup", "Verdict" ]

[[metrics.agent_group]]
agent = "(?i:ClaudeBot)"
group = "ClaudeBot"

[[metrics.agent_group]]
agent = "(?i:AmazonBot)"
group = "Amazon"

[[metrics.agent_group]]
agent = "(?i:GPTBot|ChatGPT)"
group = "GPTBot"

[[metrics.agent_group]]
agent = "."
group = "Other"